
Key Highlights
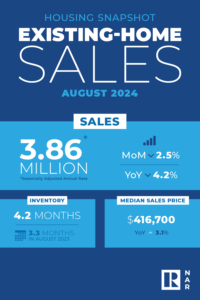
- Existing-home sales retreated 2.5% in August to a seasonally adjusted annual rate of 3.86 million. Sales slid 4.2% from one year ago.
- The median existing-home sales price rose 3.1% from August 2023 to $416,700, the 14th consecutive month of year-over-year price increases.
- The inventory of unsold existing homes improved by 0.7% from the previous month to 1.35 million at the end of August, or the equivalent of 4.2 months’ supply at the current monthly sales pace.
WASHINGTON (September 19, 2024) – Existing-home sales fell in August, according to the National Association of REALTORS®. Three out of four major U.S. regions posted sales declines while the Midwest registered no change. Year-over-year, sales slipped in three regions but remained stable in the Northeast.
Total existing-home sales – completed transactions that include single-family homes, townhomes, condominiums and co-ops – descended 2.5% from July to a seasonally adjusted annual rate of 3.86 million in August. Year-over-year, sales retracted 4.2% (down from 4.03 million in August 2023).
“Home sales were disappointing again in August, but the recent development of lower mortgage rates coupled with increasing inventory is a powerful combination that will provide the environment for sales to move higher in future months,” said NAR Chief Economist Lawrence Yun. “The home-buying process, from the initial search to getting the house keys, typically takes several months.”
Total housing inventory registered at the end of August was 1.35 million units, up 0.7% from July and 22.7% from one year ago (1.1 million). Unsold inventory sits at a 4.2-month supply at the current sales pace, up from 4.1 months in July and 3.3 months in August 2023.
“The rise in inventory – and, more technically, the accompanying months’ supply – implies home buyers are in a much-improved position to find the right home and at more favorable prices,” Yun added. “However, in areas where supply remains limited, like many markets in the Northeast, sellers still appear to hold the upper hand.”
The median existing-home price for all housing types in August was $416,700, up 3.1% from one year ago ($404,200). All four U.S. regions posted price increases.
REALTORS® Confidence Index
According to the monthly REALTORS® Confidence Index, properties typically remained on the market for 26 days in August, up from 24 days in July and 20 days in August 2023.
First-time buyers were responsible for 26% of sales in August – matching the all-time low last seen in November 2021 – and down from 29% in both July 2024 and August 2023. NAR’s 2023 Profile of Home Buyers and Sellers – released in November 2023 – found that the annual share of first-time buyers was 32%.
All-cash sales accounted for 26% of transactions in August, down from 27% in both July and one year ago.
Individual investors or second-home buyers, who make up many cash sales, purchased 19% of homes in August, down from 13% in July 2024 and 16% in August 2023.
Distressed sales – foreclosures and short sales – represented 1% of sales in August, unchanged from last month and the previous year.
Mortgage Rates
According to Freddie Mac, the 30-year fixed-rate mortgage averaged 6.2% as of September 12. That’s down from 6.35% one week ago and 7.18% one year ago.
Single-family and Condo/Co-op Sales
Single-family home sales decreased 2.8% to a seasonally adjusted annual rate of 3.48 million in August, down 3.3% from the previous year. The median existing single-family home price was $422,100 in August, up 2.9% from August 2023.
Existing condominium and co-op sales in August were identical to July at a seasonally adjusted annual rate of 380,000 units, down 11.6% from one year ago (430,000 units). The median existing condo price was $366,500 in August, up 3.5% from the prior year ($354,200).
Regional Breakdown
Existing-home sales in the Northeast in August faded 2.0% from July to an annual rate of 480,000, which was identical to August 2023. The median price in the Northeast was $503,200, up 7.7% from last year.
In the Midwest, existing-home sales were unchanged in August at an annual rate of 920,000, down 5.2% from the previous year. The median price in the Midwest was $315,400, up 3.8% from August 2023.
Existing-home sales in the South waned 3.9% from July to an annual rate of 1.73 million in August, down 6.0% from one year before. The median price in the South was $367,000, up 1.6% from one year earlier.
In the West, existing-home sales declined 2.7% in August to an annual rate of 730,000, down 1.4% from a year ago. The median price in the West was $622,500, up 2.2% from August 2023.
About the National Association of REALTORS®
The National Association of REALTORS® is America’s largest trade association, representing 1.5 million members involved in all aspects of the residential and commercial real estate industries. The term REALTOR® is a registered collective membership mark that identifies a real estate professional who is a member of the National Association of REALTORS® and subscribes to its strict Code of Ethics.
# # #
For local information, please contact the local association of REALTORS® for data from local multiple listing services (MLS). Local MLS data is the most accurate source of sales and price information in specific areas, although there may be differences in reporting methodology.
NOTE: NAR’s Pending Home Sales Index for August is scheduled for release on September 26, and Existing-Home Sales for September will be released on October 23. Release times are 10 a.m. Eastern.
1 Existing-home sales, which include single-family, townhomes, condominiums and co-ops, are based on transaction closings from Multiple Listing Services. Changes in sales trends outside of MLSs are not captured in the monthly series. NAR benchmarks home sales periodically using other sources to assess overall home sales trends, including sales not reported by MLSs.
Existing-home sales, based on closings, differ from the U.S. Census Bureau’s series on new single-family home sales, which are based on contracts or the acceptance of a deposit. Because of these differences, it is not uncommon for each series to move in different directions in the same month. In addition, existing-home sales, which account for more than 90% of total home sales, are based on a much larger data sample – about 40% of multiple listing service data each month – and typically are not subject to large prior-month revisions.
The annual rate for a particular month represents what the total number of actual sales for a year would be if the relative pace for that month were maintained for 12 consecutive months. Seasonally adjusted annual rates are used in reporting monthly data to factor out seasonal variations in resale activity. For example, home sales volume is normally higher in the summer than in the winter, primarily because of differences in the weather and family buying patterns. However, seasonal factors cannot compensate for abnormal weather patterns.
Single-family data collection began monthly in 1968, while condo data collection began quarterly in 1981; the series were combined in 1999 when monthly collection of condo data began. Prior to this period, single-family homes accounted for more than nine out of 10 purchases. Historic comparisons for total home sales prior to 1999 are based on monthly single-family sales, combined with the corresponding quarterly sales rate for condos.
2 Total inventory and month’s supply data are available back through 1999, while single-family inventory and month’s supply are available back to 1982 (prior to 1999, single-family sales accounted for more than 90% of transactions and condos were measured only on a quarterly basis).
3 The median price is where half sold for more and half sold for less; medians are more typical of market conditions than average prices, which are skewed higher by a relatively small share of upper-end transactions. The only valid comparisons for median prices are with the same period a year earlier due to seasonality in buying patterns. Month-to-month comparisons do not compensate for seasonal changes, especially for the timing of family buying patterns. Changes in the composition of sales can distort median price data. Year-ago median and mean prices sometimes are revised in an automated process if additional data is received.
The national median condo/co-op price often is higher than the median single-family home price because condos are concentrated in higher-cost housing markets. However, in a given area, single-family homes typically sell for more than condos as seen in NAR’s quarterly metro area price reports.
4 Survey results represent owner-occupants and differ from separately reported monthly findings from NAR’s REALTORS® Confidence Index, which include all types of buyers. The annual study only represents primary residence purchases, and does not include investor and vacation home buyers. Results include both new and existing homes.
5 Distressed sales (foreclosures and short sales), days on market, first-time buyers, all-cash transactions and investors are from a monthly survey for the NAR’s REALTORS® Confidence Index, posted at nar.realtor.