
Key Highlights
- Pending home sales rose for the third consecutive month, up 0.8% from January.
- Month-over-month, contract signings increased in three U.S. regions but declined in the West.
- Pending home sales decreased in all four regions compared to one year ago.
WASHINGTON (March 29, 2023) – Pending home sales grew in February for the third consecutive month, according to the National Association of REALTORS®. Three U.S. regions posted monthly gains, while the West declined. All four regions saw year-over-year decreases in transactions.
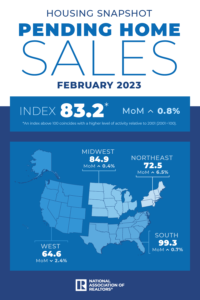
The Pending Home Sales Index (PHSI)* — a forward-looking indicator of home sales based on contract signings — improved 0.8% to 83.2 in February. Year-over-year, pending transactions dropped by 21.1%. An index of 100 is equal to the level of contract activity in 2001.
“After nearly a year, the housing sector’s contraction is coming to an end,” said NAR Chief Economist Lawrence Yun. “Existing-home sales, pending contracts and new-home construction pending contracts have turned the corner and climbed for the past three months.”
Pending Home Sales Regional Breakdown
The Northeast PHSI raised 6.5% from last month to 72.5, a drop of 17% from February 2022. The Midwest index improved 0.4% to 84.9 in February, a decline of 16.5% from one year ago.
The South PHSI grew 0.7% to 99.3 in February, dropping 21.7% from the prior year. The West index decreased 2.4% in February to 64.6, shrinking 28.4% from February 2022.
“The affordable U.S. regions – the Midwest and South – are leading the recovery,” Yun added. “Mortgage rates have improved in recent weeks after the federal government guaranteed the status of most mortgages amidst uncertainty in the financial market. While access to commercial mortgage loans could become increasingly difficult, residential mortgage loans are expected to be more readily available.”
The National Association of REALTORS® is America’s largest trade association, representing more than 1.5 million members involved in all aspects of the residential and commercial real estate industries. The term REALTOR® is a registered collective membership mark that identifies a real estate professional who is a member of the National Association of REALTORS® and subscribes to its strict Code of Ethics.
# # #
*The Pending Home Sales Index is a leading indicator for the housing sector, based on pending sales of existing homes. A sale is listed as pending when the contract has been signed but the transaction has not closed, though the sale usually is finalized within one or two months of signing.
Pending contracts are good early indicators of upcoming sales closings. However, the amount of time between pending contracts and completed sales is not identical for all home sales. Variations in the length of the process from pending contract to closed sale can be caused by issues such as buyer difficulties with obtaining mortgage financing, home inspection problems, or appraisal issues.
The index is based on a sample that covers about 40% of multiple listing service data each month. In developing the model for the index, it was demonstrated that the level of monthly sales-contract activity parallels the level of closed existing-home sales in the following two months.
An index of 100 is equal to the average level of contract activity during 2001, which was the first year to be examined. By coincidence, the volume of existing-home sales in 2001 fell within the range of 5.0 to 5.5 million, which is considered normal for the current U.S. population.
NOTE: Existing-Home Sales for March will be reported on April 20, 2023. The next Pending Home Sales Index will be on April 27, 2023. All release times are 10 a.m. Eastern. View the NAR Statistical News Release Schedule.